
Every importer who calls about cargo tricycles starts from the same two questions: is this market still growing, and can I actually buy a unit that fits my region at a price that clears freight and duty? The demand side is real and structured, last-mile delivery economics, farm and ranch utility, and urban food and parcel routes all push operators toward small electric platforms. The supply side is even more concrete: one factory platform, three configurations, a 50-unit MOQ, a 15–30 day lead time, and a FOB band that has stayed effectively flat for three years. This briefing reads the market through what is actually buyable out of a Chinese OEM factory, region by region, then leaves you with a real configuration and a real landed-cost model instead of a vague headline number.
Two numbers matter more than any billion-dollar market estimate. First, the platform starts at $1,250 FOB for a light 800W build and tops out around $2,250 for a heavy-duty 1200W LFP unit. That is the entire accessible price floor for an electric cargo tricycle that crosses the major regulatory lines. Second, a single 40HQ container carries 20–24 standard units (up to about 30 with boxes nested), so the economics of distribution are governed by container density, not by an abstract CAGR. Get those two right and the rest of the forecast is machinery.
Three Configurations That Define the Market
The cargo-tricycle market is best understood by the actual SKUs a factory will build you, not by a single average price. The platform ships in three configurations that span the demand curve, and they cross different regulatory and payload thresholds:
| Specification | Light 800W | Standard 1000W | Heavy-Duty 1200W LFP |
|---|---|---|---|
| Motor | 800W hub, 60V | 1000W hub, 60V | 1200W hub, 72V |
| Battery | 60V 32Ah NMC | 60V 32Ah NMC | 72V 40Ah LFP |
| Range (loaded 200 kg) | 50–60 km | 60–70 km | 70–80 km |
| Payload (EU / non-EU) | 300 / 500 kg | 300 / 500 kg | 300 / 500 kg |
| Box volume | 150–300 L | 200–400 L | 300–500 L |
| Unit weight (no box) | 150–180 kg | 170–200 kg | 190–220 kg |
| Price (FOB China) | $1,250–1,550 | $1,580–1,880 | $1,880–2,250 |
| MOQ | 50 units | 50 units | 50 units |
Every config shares the same drivetrain architecture, a brushless hub motor with an integrated differential, 60V/72V, a 60V 32Ah or 72V 40Ah lithium pack with a heavy-duty BMS, hydraulic disc front and dual drum rear brakes with a parking brake, a steel-tube chassis with e-coat and powder-coat rust protection, and 3.00-12 front / 3.75-12 rear dual tires. That shared hardware is what lets an importer hold one platform and offer three price points and three payloads off a single container. The payload decision in particular is the one buyers underestimate most; the full engineering view of how load capacity is limited, tires, brakes, frame and motor, is worked through in our payload capacity guide.
Regional and Regulatory Reality
The market is not one market, and the three big regions gate the same hardware differently:
- United States . The fastest-growing Western market. The platform crosses the Class 2 e-bike line at the 800W and 1000W configs, which lets units run without a motorcycle license in many states. That is why the US wave has spread from farm and ranch use, documented in our farm and ranch guide . Into suburban delivery and municipal fleets.
- European Union . The most mature cargo-trike market, governed by L-category type-approval and city access rules rather than a single class. Units are planned against ECE R10 electromagnetic compatibility, and the eMark / L2e path decides which member states a SKU can serve. The compliance matrix is mapped in our EU vs US certification guide.
- Asia . The volume base and the OEM manufacturing heartland. The growth here is conversion of combustion three-wheelers, and it is where price competition is fiercest and where the standard-config MOQ of 50 units is most often met.
Whatever your region, the battery leaves the factory with UN 38.3 transport documentation, and each order carries cell, BMS and test-report documents in the export file. The current state of US and EU rules, and where they are heading, is tracked in our regulation guide.
The Price Reality: FOB to Landed Cost
The FOB price has stayed flat for three years because factory scale has absorbed rising battery and steel costs. That is the good news. The cost an importer must actually plan around is landed cost, and here the real drivers are container density, duty, and certification amortization:
| Cost line | Realistic figure |
|---|---|
| FOB (light 800W – heavy 1200W) | $1,250 – $2,250 |
| Chassis crate footprint | ~260 × 120 × 145 cm |
| 20GP container (chassis only) | 8–10 units |
| 40HQ container (standard) | 20–24 units; ~30 nested |
| MOQ per model | 50 units |
| Standard lead time | 15–30 days; 30–45 days first custom run |
| Free spare parts | 1% of order value, shipped in container |
Box customization adds roughly 10 days to the lead time, and the first custom-branded run typically needs 30–45 days because tooling and pre-production samples are produced before mass production. The full landed-cost model, freight, duty, certification and warehousing, is worked through in our China import guide, and the cost structure that sits inside that FOB price is broken down part by part in our cost breakdown guide.
Growth Drivers: Where the Units Actually Go
Four demand engines carry the forecast, and each has a documented use case on this site:
- Last-mile parcel and courier economics . The stop-density math that makes a 300 kg trike profitable below 15 km on intra-urban routes, covered in our cargo delivery fleet guide and courier and parcel guide.
- Food delivery and mobile vending . Hot-food routes and street vendors, where the insulated box option and the 50–80 km loaded range matter most; see our food delivery guide.
- Farm, ranch and rural utility . The US rural wave that kicked off the boom, where the 500 kg non-EU payload and the differential drive carry feed and tools over gravel.
- Municipal and government fleets . Sanitation, parks and public works programs; the procurement mechanics are in our public fleet guide.
What the Forecast Means for Importers
The actionable takeaway is that the platform gives you a real path to market without a large capital commitment. A 50-unit MOQ, a 15–30 day lead time, and a FOB band under $2,250 mean a first container is a testable bet rather than a strategic gamble. On the OEM side you can change motor power (800W–1200W with hill-climb gearing), battery chemistry (LFP for tropical and desert markets), box type (fixed, drop-side, or hydraulic tipper), and add a refrigeration unit for cold chain, box branding, canopy, or shelving. The platform logic behind a single SKU that crosses multiple regions is laid out in our cargo trike OEM guide.
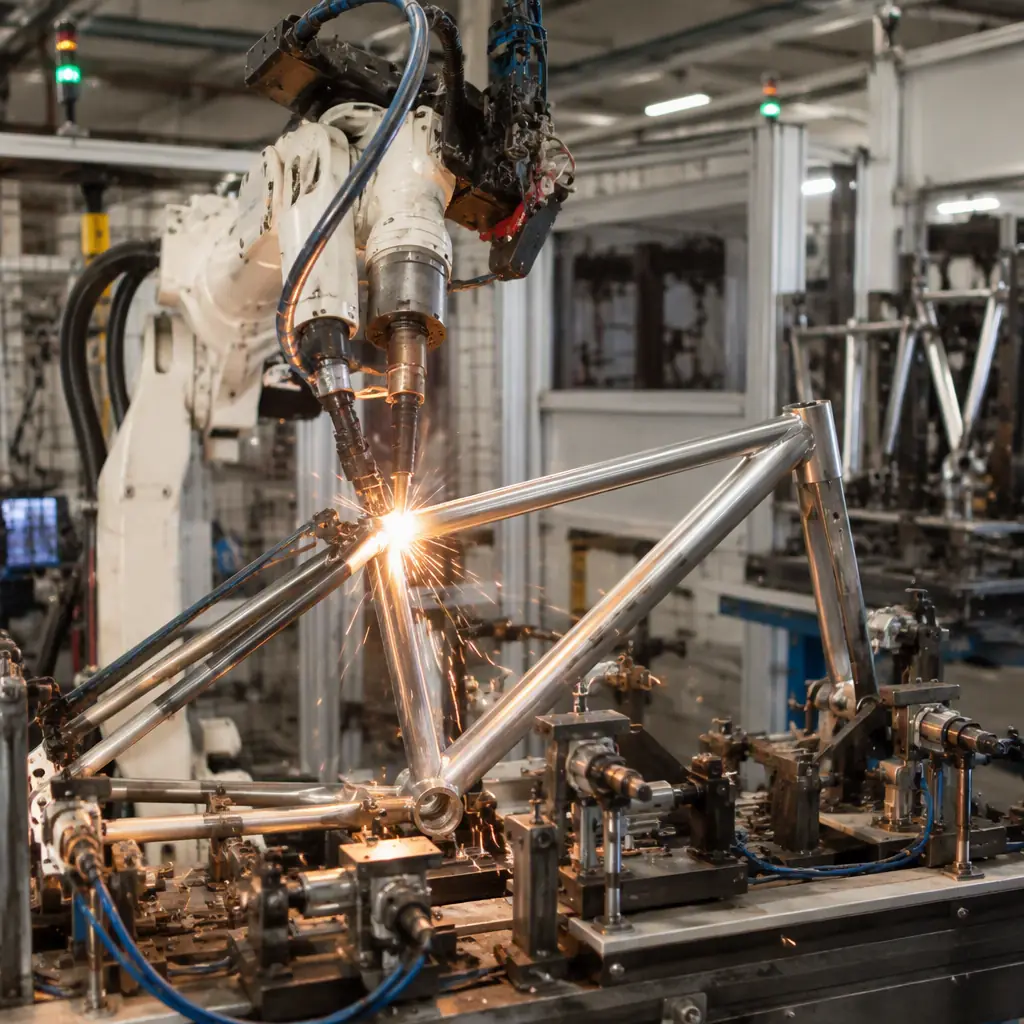
Every unit passes a per-vehicle inspection checklist covering weld integrity on the cargo subframe, torque verification on all chassis fasteners, and a loaded road test with ballast to confirm brake balance and motor thermal behavior under real duty cycles. Qualifying buyers can visit the facility, test-drive a loaded unit, inspect the welding jigs, and review QC documentation, with hotel and airport transfer arranged. Warranty is structured by the part. Chassis and cargo box 24 months, motor 18 months against MOSFET failure, water ingress (IP65), and F/N/R switch malfunction, and the battery 12 months or 800 charge cycles (NMC) or 2,000 cycles (LFP), whichever comes first. The chemistry trade-off that drives that warranty choice is explained in our battery technology guide and 60V vs 72V guide.
Risks to Any Forecast
No forecast survives contact with reality untouched. Three risks deserve a place in any plan:
- Tariffs and trade policy. US and EU tariff shifts on Chinese e-mobility products move landed costs and can shift the boundary between Class 2 trikes and full L-category vehicles.
- Battery commodity prices . Lithium and steel swings move FOB pricing; the chemistry options that hedge this are in our battery guide.
- Regulatory reclassification . If a state or member state reclassifies cabin or cargo trikes out of the e-bike class, the addressable market shifts overnight; our regulation guide tracks the current state.
Spec Your Market Entry
The cargo-tricycle market grows on a real, buyable platform. Three configurations from $1,250 to $2,250 FOB, a 50-unit MOQ, a 15–30 day lead time, and a 40HQ that carries 20–24 units. The operators who capture that growth are the ones with a region, a certification, and a container plan, all three of which we spec with importers every week.
Enter the Cargo Trike Market
Tell us your target region, distribution channel, and volume plan. We will spec the right platform, certification package, and container plan for your market entry.
